Didim Property Outlook 2026:
The Rise of Seyrantepe & Yeşiltepe
In a district whose population grew 176% in 21 years, title-deed activity clusters in a single neighbourhood. A data-driven portrait of the Seyrantepe–Yeşiltepe area: a complete 508-listing supply census, a 16-year official transaction series and a currency-adjusted price analysis.
1 · The 100k threshold: Didim is no longer a small coastal town
Didim's population was 37,395 in 2004. By the end of 2025 it stood at 103,141 — a 176% increase in 21 years, several times the national average. This is not seasonal tourism swell; it is registered, year-round residency. Retirement migration, remote work and an inland-to-coast settlement wave keep enlarging the district's permanent housing need.
Didim population: 2004 → 2025
Source: TurkStat Address-Based Population Registration System
2 · The heart of title-deed activity: a single red zone
According to the Land Registry's (TKGM) parcel-level transaction-density analysis, the only high-density cluster on Didim's 2025 map is Akyeniköy — the neighbourhood containing Seyrantepe and Yeşiltepe. Nothing comparable appears anywhere else in the district, including the Altınkum coast, the town centre or Akbük.
The yearly series tells the area's story: averaging ~980 activity points a year in 2010-2014, the neighbourhood jumped to the 3,000-4,500 band with the 2015-16 cooperative-conversion wave, then peaked at 5,491 in 2021 — 5.6× the 2010 level. In 2024-25 the series settled back to 1,900-2,100, still roughly double a decade ago.
2025 transaction density — Seyrantepe & Yeşiltepe
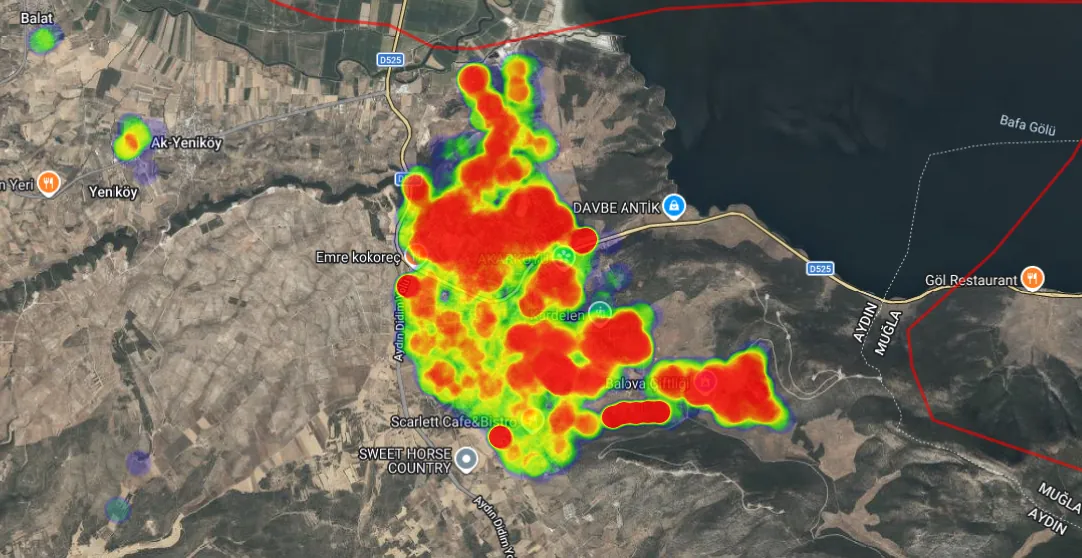
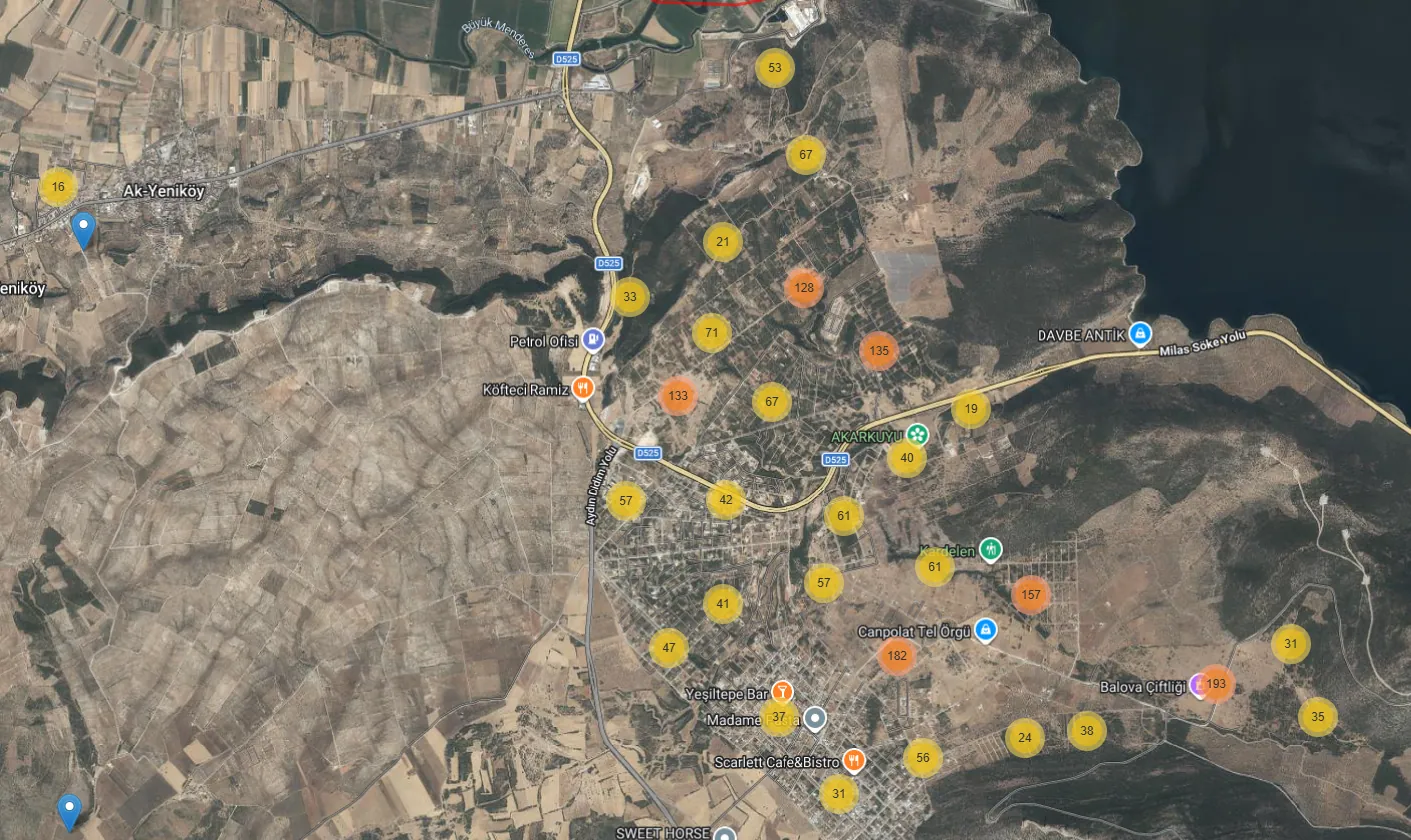
Source: TKGM Parcel Query application, transaction-density analysis, 2025 (public data, accessed 09.07.2026)
Akyeniköy — annual title-deed activity points (2010-2025)
Source: TKGM Parcel Query / GIS analysis service, transaction-density layer (retrieved 09.07.2026)
3 · The supply picture: still in the "plot phase"
In July 2026 we counted every active sale listing in Akyeniköy, one by one: 508 plots and 80 homes. 86% of supply is land — the signature of the earliest stage on a district's development curve. For comparison, mature coastal neighbourhoods show the reverse. And 64% of the housing supply is villas: this is a detached-living market, not an apartment one.
Composition of active listings — Akyeniköy, July 2026
Source: RedRock full supply census, sahibinden.com Ak-Yeniköy, 09.07.2026 (duplicates removed)
Land supply splits into two clear classes: 300-350 m² newly subdivided plots (Balova, Kardelen) making up 54% of the market, and 500-760 m² classic villa plots at 29%. The striking part: unit prices normally fall as plots get bigger — here the pattern reverses —
The large-plot premium — median unit price (TL/m²)
The 600-700 m² "full villa plot" is scarce and carries a premium · RedRock census (n=495)
4 · The price ladder: maturity is priced in
Median unit prices by location draw a clean ladder: newest subdivision Balova at 4,860 TL/m², Kardelen 5,500, Seyrantepe 6,510 and the most established, Yeşiltepe, at 8,050 TL/m². Yeşiltepe carries a 24% premium over Seyrantepe — the numerical expression of this report's core thesis: Seyrantepe today is where Yeşiltepe stood 5-10 years ago. (Get to know the areas: Seyrantepe guide · Yeşiltepe guide) A gap expected to narrow as infrastructure and settlement density build up.
Location premium ladder — median land unit price (TL/m²)
Source: RedRock supply census (location from listing titles, n=495) · cross-validated with Endeksa's neighbourhood average (5,455 TL/m²)
The entry ticket remains low: 56% of listings sit below 2.5 million TL. The villa-plot segment concentrates in the 4-6 million band.
Land prices by segment — Akyeniköy, July 2026
| Plot class | Listings | Median price | Median unit |
|---|---|---|---|
| 300-350 m² (new subdivision) | 279 | 1,50 M TL | 4.860 TL/m² |
| 351-499 m² | 48 | 3,13 M TL | —* |
| 500-630 m² (villa plot) | 87 | 3,85 M TL | 6.790 TL/m² |
| 631-760 m² (villa plot) | 64 | 5,08 M TL |
*The 351-499 band is small and mixed; its unit price should not be read alone. All prices are asking prices. · RedRock census, 09.07.2026
Home prices by segment — same area, for context
| Segment | Listings | Median price | Range |
|---|---|---|---|
| Studio / 1-bed (new-build complexes) | 9 | 3,0 M TL | 2,65 – 7,3 M |
| 2+1 / 2+2 | 19 | 3,9 M TL | 3,05 – 17,75 M |
| 3-bed and larger (villa class) | 52 | 14,75 M TL | 3,25 – 38 M |
Housing data is for context: that a 600-700 m² plot plus construction can total below the ready-villa median is the economic case behind the area's "buy land, build" preference. · RedRock census
5 · The currency effect: what is driving the increase?
By the area index, residential-zoned land rose +16.7% in TL over the past year and +31.4% over two years. How much of that is real appreciation, and how much is currency? Over the same two years the dollar rose 43.4% against the lira. Had the dollar stayed flat — stripping the currency effect out of the table — land prices are actually down 8.3% in dollar terms despite the visible TL increase:
If the dollar had stayed flat: two years of a 100-unit plot (Jun 2024 = 100)
Source: Endeksa Ak Yeniköy residential-zoned land index + USD/TRY (as of June 2026)
There are two readings. For the TL-earning domestic investor, the area has appreciated steadily for two years, and the index provider's forward 12-month estimate is +20.8%. For a foreign-currency buyer, the same area is cheaper than two years ago — a rare entry window in a place whose population, transaction volume and infrastructure are all growing. An average selling time of 86 days shows that window sits in a liquid market.
6 · Conclusions: what the data says
One: Didim's growth rests on permanent population, and the district's title-deed activity clusters in a single neighbourhood — Akyeniköy. Two: By supply composition the area is still early on its development curve; land stock is broad, but the classic 600-700 m² villa plot is getting scarce and carries a premium. Three: The price ladder between locations makes the return on maturity measurable; the Seyrantepe-Yeşiltepe gap is 24%. Four: Despite steady TL growth, the area is cheaper in dollar terms than two years ago — for a data-minded buyer, the currency window is the most striking line in the table.
Get to know the areas
Sources & citation
- TÜİK, Address-Based Population Registration System (ADNKS), 2004-2025
- TKGM Parsel Sorgu Uygulaması, transaction-density analysis (accessed 09.07.2026)
- RedRock Properties, full Akyeniköy supply census (09.07.2026)
- Endeksa, Ak Yeniköy residential-zoned land index (June 2026)
This report may be quoted with attribution: "RedRock Properties — Didim Property Outlook 2026, didimproperties.com". Questions about the dataset and charts: [email protected]
© 2026 RedRock Properties · RedRock Gayrimenkul — All rights reserved.